A Virtual NASA Ocean Portal to Explore Sea Level Rise Around the World
10/28/2020 Torrential storms and fierce hurricanes push farther inland than they once did, threatening homes, roads, bridges, water supplies, and sewage treatment plants.
Extreme weather events are expected to intensify as global temperatures rise, causing glaciers and ice sheets to melt and the ocean to expand. Sea levels are rising approximately 0.13 inches (3.3 millimeters) a year. Global average sea level has risen 8 to 9 inches (21 to 24 centimeters) since 1880, with about a third of that rise occurring in the last two and a half decades.
To help scientists and decision makers study this global phenomenon and better understand its consequences, researchers at NASA’s Jet Propulsion Laboratory in Southern California, created the Sea Level Data Analysis Tool, an accessible, interactive portal that helps users visualize sea level rise, among other ocean variables, for specific regions around the world. This popular interactive and visualization tool is powered by NASA’s OceanWorks technology and it is available through the Apache Software Foundation as a Science Data Analysis Platform.
“This is a first-of-its-kind data analysis tool for Earth science,” Thomas Huang, the OceanWorks’ principal investigator based at JPL, said. “You can flip to different time periods and see how sea level is changing around the world,” he said.
So much data in so little time
OceanWorks is an analytic framework solution to harmonize relevant oceanographic parameters for climate and ocean research, Huang said. It can help you explore your curiosity about ocean currents off the coast of Florida and explain how salinity has changed over the past ten years off the coast of Peru.
OceanWorks combines a wide variety of data from space-based sensors, like the Moderate Resolution Imaging Spectrometer (MODIS) aboard the Terra and Aqua satellites, the Visible Infrared Imaging Radiometer Suite aboard the Suomi National Polar-Orbiting Partnership spacecraft, and the Tropical Rainfall Measuring Mission (TRMM), to airborne measurements from science campaigns to on-the-ground instruments on buoys, shores, and boats.
The portal also leverages data distributed through the NASA’s Physical Oceanography Distributed Active Archive Center (PO.DAAC), which is a NASA Earth Observing System Data and Information System data center operated by JPL. The center began archiving oceanographic data in 1978, when Seasat, NASA’s first ocean-observing satellite, launched. Since then, the PO.DAAC has accumulated millions of remotely sensed measurements on sea surface topography, ocean temperature, ocean winds, salinity, gravity, and ocean circulation.
The portal’s advanced algorithms digest and synthesize this immense amount of data to display a comprehensive visualization of ocean currents, salinity, rain rate, ocean temperature, and sea level rise, among many variables, over a specific location.
“NASA has a broad, global view of the ocean,” Ben Hamington, a scientist at JPL and team lead of the NASA Sea Level Change Science Team, said, “and that’s something that’s very important for sea level science.”
The upcoming European Science Agency (ESA) Sentinel-6 Mike Freilich satellite launch in November 2020 will add to the continuous record of sea level data since 1993. “The longer the record, the better we can see natural versus anthropogenic contributors to sea level rise,” Hamlington said.
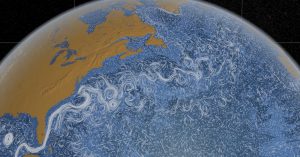
Surface currents circulate in this high-resolution, 3D model of the Earth’s oceans.
Credit: NASA’s Goddard Space Flight Center
Projecting potential changes
Although Oceanworks is the analytic framework that powers NASA’s Sea Level Change Data Analysis Tool, both portals allow users to visualize sea level rise as a global problem with local impacts, Hamlington said.
For instance, the portals allow users to understand what causes sea level rise to be higher in one part of the ocean than the other, which is important for both studying ocean dynamics and preparing decision makers for impacts.
Current projections extend to the year 2100 and beyond, but sea level rise is an issue now. “Whatever we can do as scientists to help understand what’s causing sea level to rise and help predict what sea level will look like in the near future is critical to society,” Hamlington said.
OceanWorks’ development was supported through an investment by NASA’s Advanced Information Systems program. In addition to NASA’s Sea Level Change Data Analysis Tool, OceanWorks’s analytic framework is also powering NASA’s GRACE Follow-On Data Analysis Tool, NASA’s Estimating the Circulation and Climate of the Ocean Analysis, and the Committee of Earth Observation Satellites Ocean Variables Enabling Research and Applications for GEO Initiative.
Elizabeth Goldbaum