NASA TACLS software helps provide quick warnings for flash floods
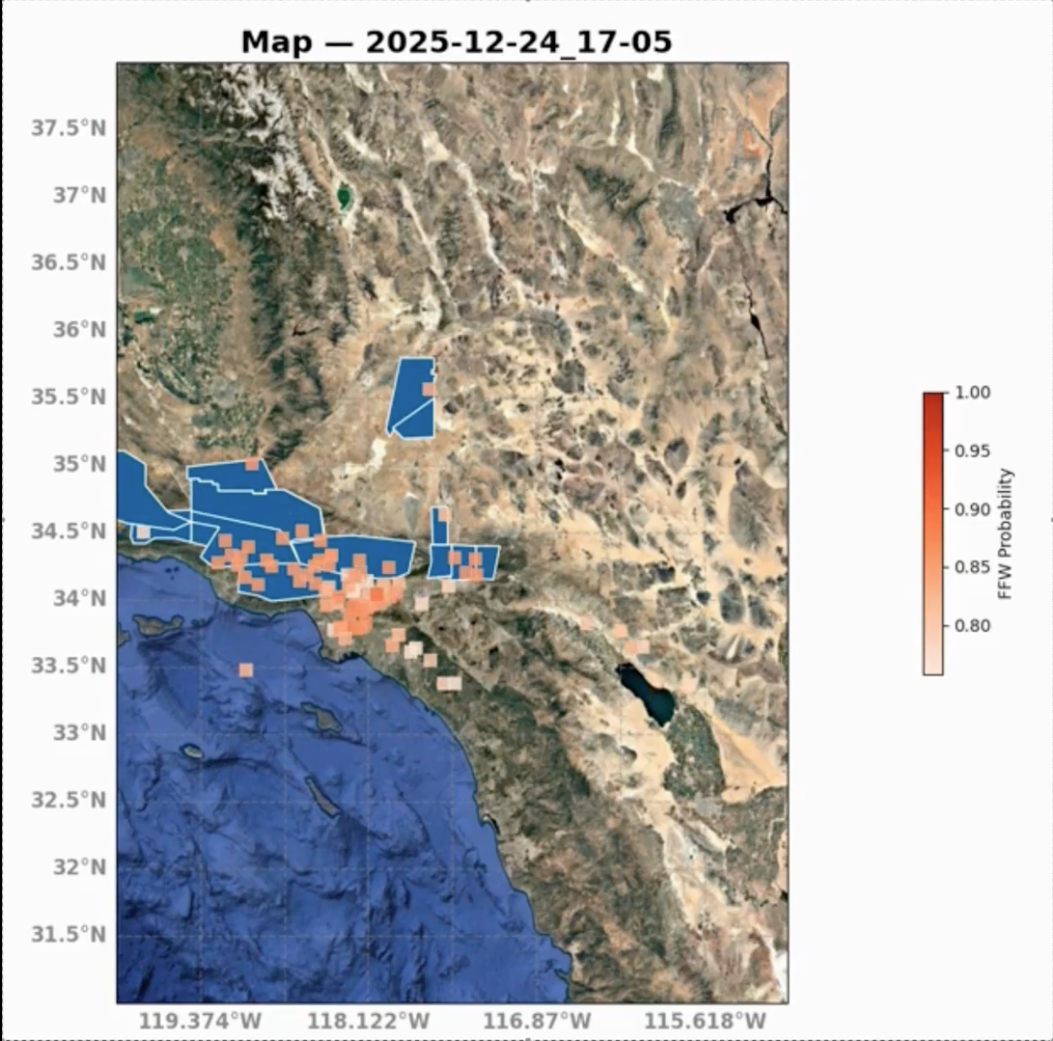
A visual analysis from a TACLS test prediction run using data from floods the week of Christmas, 2025. This image shows flash flood warning (FFW) probabilities generated by TACLS (in shades of red) and overlaid on areas that actually received flash flood warnings from the National Weather Service (in blue). (Credit: Scripps)
03/30/26 – A collection of machine learning algorithms developed by researchers at NASA’s Jet Propulsion Laboratory (JPL), the University of California, San Diego (UCSD), and NOAA will soon help meteorologists rapidly track the movement of severe weather and predict where and when flash flooding may occur.
Created with support from NASA’s Earth Science Technology Office (ESTO), the “Transient Artifact and Continuous Learning System (TACLS)” locates subtle evidence of impending severe weather that may otherwise be lost in the massive amounts of data human analysts have to sort through each day. TACLS flags data indicating levels and patterns of moisture in the atmosphere for human analysts to interpret. The analyst can then decide whether or not the information flagged by AI indicates a likely flash flooding event, and if necessary, issue a weather advisory.
Yehuda Bock, Distinguished Researcher at UCSD’s Scripps Institution of Oceanography and principal investigator for TACLS, explained that this technology has its roots in a research project from 2008, which leveraged novel data fusion techniques to detect seismic activity more efficiently.
In 2011, Bock teamed up with co-investigator Angelyn Moore, a scientist within JPL’s Ionospheric and Atmospheric Remote Sensing group, as well as researchers from the NOAA’s National Weather Service in San Diego and Oxnard, to see if these data fusion techniques could also help weather forecasters better track fast-changing atmospheric features.
As the project progressed, they realized that by incorporating machine learning into their models, they could not only track atmospheric rivers and other fast-changing “transient” precipitation events, but also detect when those events might indicate that an extreme weather warning should be issued.
“So not only do we want to track the weather event, but we also want to give the meteorologists a tool for them to decide whether to issue a flash flood warning at a particular time and place,” said Bock.
Ivory Small, a meteorologist at NOAA’s National Weather Service and a co-investigator on the project, compared TACLS with automatic brakes. “When you don’t see how close you are to the car ahead of you, they activate and say ‘hey, pay attention to this.’ What you may be missing is something the AI may be catching.”
JPL has decades of experience using machine learning and artificial intelligence to solve science problems, said Umaa Rebbapragada, Technical Group Supervisor at JPL’s Machine Learning and Instrument Autonomy Group and TACLS co-investigator.
The team successfully integrated three decades of Southern California GNSS ground station data with three independent datasets covering atmospheric rivers, heavy precipitation, and flash flood warnings. Despite these sources being quite different from one another, the team developed a framework to unify them, a significant technical feat.
The data used to train TACLS is available to the public and free to download, allowing meteorologists to either tailor TACLS to better suit their research goals or create their own models for improving meteorologists’ ability to forecast severe weather.
“Labeled data sets are a rare commodity in science. It takes a lot of work to get it done, so that’s one of the benefits coming out of this project,” said Rebbapragada.
The system also includes a visualization component (MGViz) that allows meteorologists to follow storm movement and view measurements from GNSS ground stations in near real time. Joe Roberts, Technical Group Supervisor of JPL’s Science and Geospatial Visualization group and a co-investigator for TACLS, explained that this user-friendly feature highlights areas where flash flooding may occur.
The software, based on the Multi-Mission Geographic Information System (MMGIS) and originally developed at JPL for NASA’s Mars Missions, was adapted to meet the goals of the TACLS project.
During a simulation, TACLS successfully demonstrated where in California flash flooding would occur during heavy rains on Christmas week, 2025, and the National Weather Service is already integrating the software into the systems they currently use to forecast severe weather in southern California.
Ultimately, this project demonstrates the novel capabilities scientists will have as they continue to work with artificial intelligence.
“There’s not really a tool like this already. We can be a little bit quicker if we use AI and machine learning to supplement the monitoring ability of a meteorologist,” said Small.
ESTO’s Advanced Information System Technology (AIST) program funds this project. For more information on AIST’s work creating new models for understanding complex Earth systems, click here.
Gage Taylor, NASA Earth Science Technology Office